Accounting and financial analysis abilities are required to read financial statements. The knowledge that thousands of successful investors demonstrate that expert-level expertise in these fields is not required to succeed as an investor. Having said that, investors must develop common sense in order to judge business trends, and skills in order to detect profitable financial data patterns. These patterns may be learned by regular observation and practise by anyone interested in markets. It has been proven that pattern detection and practise, rather than text book narratives, help people learn faster and better.
How to Read Financial Performances for Smart Investing?
How to learn and profit from financial data, based on market patterns that work
The basics (for example): When we put a fixed deposit with HDFC Bank, we do so in order to receive a guaranteed return (interest) in the future. In equity markets, dividends are paid out over time in the form of business earnings (EPS and cash flows). Smart investors identify and invest in firms that are anticipated to post substantial EPS growth in the following 1-2 years as early as possible.
Here’s how to learn and profit from financial data based on market patterns that work.
Companies that report strong and trend-beating performances have better chances of continuing to perform well in the future. Let's look at why this occurs. Assume you recently passed the IAS or IIT exam. You'd be in a sweet spot of great opportunity, as your reputation and earnings are likely to rise in the coming years. Similarly, if a company's quarterly financial data shows that it is in a good economic situation as a result of policy changes or consumer preferences, it is in a good economic situation. This pattern can persist for months, if not years. How would you recognise this pattern in financial data?

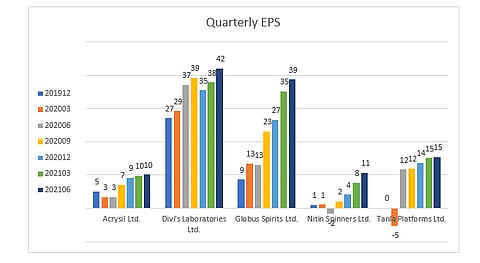
1. The first step is to look for companies that have experienced a significant increase in earnings. There are numerous financial terminals that provide relevant performance data. What should you look for in this information? Expect a significant increase in quarterly revenue, EBITDA, EBITDA Margin, and EPS. These are the four most significant quarterly financial data indicators, if you're new to finance. The definitions and meanings will be available simply by searching on Google. The present growth trend should be significantly higher than the growth trend over the previous four to eight quarters (see chart). It is worth highlighting some major observation points:
- The spike should not be just in one quarter but a clear growth trend should be visible. Reviewing the growth (quarterly YoY and QoQ, annual YOY, 3-year CAGR etc) across time frames should validate the trend. This is important because the mathematics of financial data can throw up funny results at times. For example, a single quarter EPS growth can be as high as 2000 per cent, where profits jumped from Rs 0.5 crore to Rs 10 crore. However, viewed as per different time frames, the possible growth rates may be just 5 per cent. These companies should be avoided.
- Make sure for companies with market capitalisations of less than Rs 2000 crore, the growth trend is sharper.
- The recent (3, month, 1 month) post result price movement for the company should give a good confirmation of investor interest in the stock.
Finally, investing early in this trend is key to reaping the full upside in the stock. This may be tough because the growth trend may not be fully visible at early stage of trend.
2. The second step is to figure the reason why the company reported strong performance. A quick Google search should turn up news stories about the strong performance. Consider the main factors or economic levers for yourself. For instance, if you're trying to figure out why Nitin Spinners, a textile company, has reported strong earnings, you should be able to locate news about a prohibition on cotton shipments from China's Uighur province, which is a major rival to Indian cotton. You should also learn that textile exports to the United States are rapidly increasing. Again, when examining Globus Spirits, an alcohol and spirits maker, a wealth of information on the benefits of the new ethanol policy issued by the Indian government is available. Both of these companies' earnings have increased dramatically, as have their stock values.
This method of reading financial data can be mastered easily with regular tracking. A quick review of stocks at 52-week high and those hitting circuit can help spot such market leading performers.
The author is Founder, Equity Levers
DISCLAIMER: Views expressed are the author's own, and Outlook Money does not necessarily subscribe to them. Outlook Money shall not be responsible for any damage caused to any person/organisation directly or indirectly.