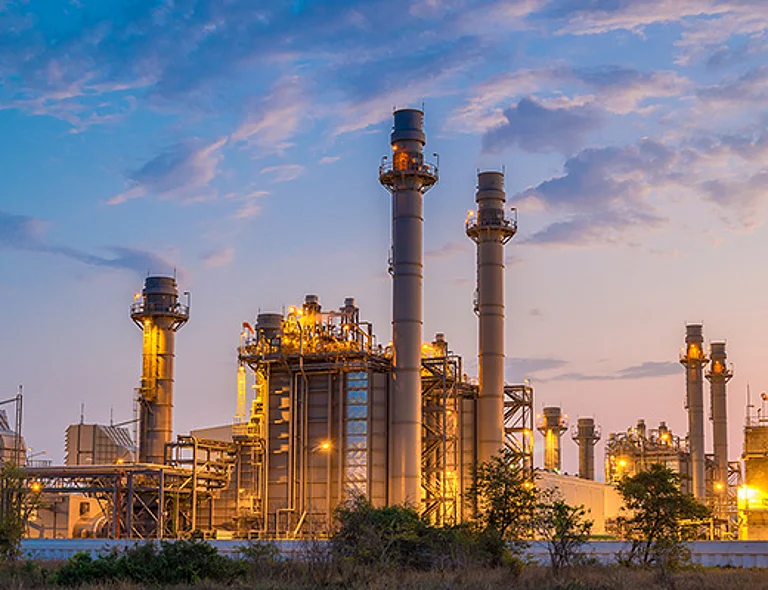
India’s Purchasing Managers' Index (PMI) declined to a measure of 60.1 in August. However, this data also showed that Indian exports were at a record high amidst strong international demand of Indian goods. The PMI is released and recorded by the S&P Global India Services and is an index of the direction of economic trends in the manufacturing and service sectors.
Despite falling from 62.3 in July to 60.1 in August, the seasonally adjusted S&P Global India Services PMI Business Activity Index indicated one of the strongest increases in output seen since mid-2010.
The headline figure was above the neutral 50 threshold for the 25th straight month. In Purchasing Managers' Index (PMI) parlance, a figure above 50 means expansion, while a score below 50 denotes contraction in the sector.
1 June 2026
Get the latest issue of Outlook Business

"Indian services companies achieved a remarkable milestone in August, as they welcomed a series-record surge in new export business. Several regions contributed to the upturn, including Asia Pacific, Europe, North America and the Middle East," said Pollyanna De Lima, economics associate director at S&P Global.
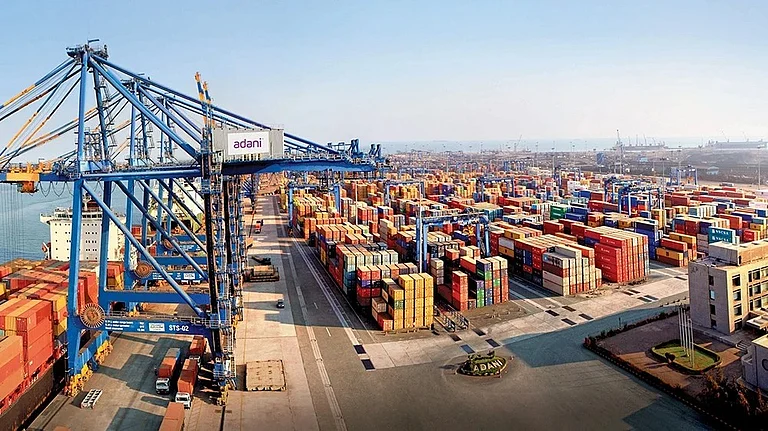


"This spike in international demand supported one of the best sales performances recorded over the past 13 years, and acted as a catalyst for firms to expand their workforces as well as output," Lima noted.
The S&P Global India Composite PMI Output Index -- which measures combined services and manufacturing output -- fell from 61.9 in July to 60.9 in August. Despite the fall, the S&P Global India Composite PMI Output Index was indicative of a sharp rate of expansion that was among the strongest in over 12 years, the survey said.
PMI is compiled by S&P Global from responses to questionnaires sent to a panel of around 400 service sector companies. The panel is stratified by detailed sector and company workforce size, based on contributions to GDP. Data collection began in December 2005.
With inputs from PTI