New Delhi, November 12: The compound annual growth rate (CAGR) of S&P BSE Sensex during FY17, 18 and 19 was 15.1 per cent, second only to NASDAQ, analysed a report by KPMG in India.
The publication is an analysis of the performance of equity IPOs that were listed on the main exchanges --. Bombay Stock Exchange (BSE) and National Stock Exchange (NSE) -- during the three financial years ended March 31, 2017 (FY17); March 31, 2018 (FY18) and March 31, 2019 (FY19).
It analyses the relative performance of IPOs of the 85 companies that were listed during FY17, FY18 and FY19, across various parameters including but not limited to their listing performance, the use of funds raised and cost of issue.
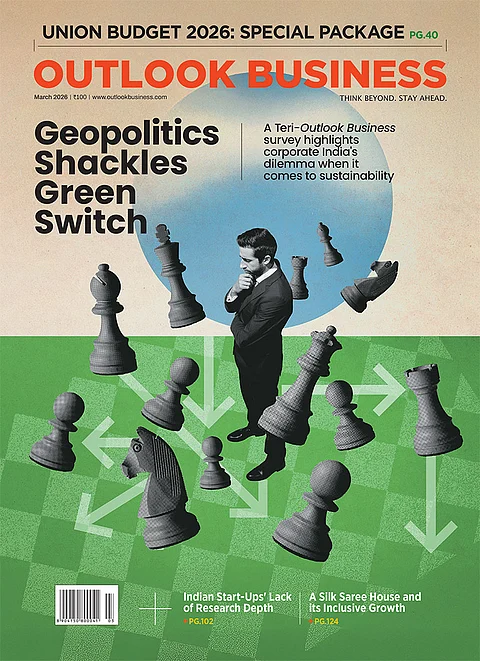
2 March 2026
Get the latest issue of Outlook Business

The report ‘IPOs in India: Performance Highlights’ analyses the performance of all IPOs in India across sectors, between April 2016 and March 2019. The report includes in-depth analysis of listing day performance, subscription details, size of offering, use of funds and costs of issue.


The year FY17 there were 26 IPOs, FY18 had 41 IPOs and FY19 had 18 IPOs.
The IPOs that cumulatively raised over Rs 121,300 Crore from FY17 to FY19, saw subscription of around Rs 1,825,200 Crore, putting the subscription to funds raised ratio at 15 times. While Financial Services was the sector with the maximum activity in terms of funds raised and subscription by amount during the three-year period garnering 64 per cent of funds raised and 49 per cent of subscription, it was in the bottom half of the 16 sectors in terms of subscription to funds raised ratio, at 11.4 times.
The report said the Indian stock market performance in FY19, was marked by outperformance, correction and consolidation, with its fair share of sharp rises and declines. From April to August 2018, the S&P BSE SENSEX gained 17 per cent. This was the all time high level, post which the market sharply corrected by 14.3 per cent over the next two months. This was driven by foreign fund outflow to the tune of Rs 27,623 Crore ($3,953 mn) in October 2018. The markets began to recover in November 2018, with a series of moderate run-ups and corrections.
The stellar performance of S&P BSE SENSEX and Nifty 50 compared to their peers, can be attributed to the fact that two of the past three years, have witnessed net FII/ FPI inflows of Rs 55,703 Crore (FY17) and Rs 25,635 Crore (FY18), in the Indian equity market. The inflows were due to several underlying factors that made the market attractive and hence, better performing.
There was a net outflow of Rs 88 Crore by FIIs/FPIs in FY19, led by the sell-off in October 2018, partially off-set by the late infusion post mid-February and in March.
The report stated that 40 companies generated double digit positive listing day returns, during the three year period.
In terms of listing day returns, the non-PE backed companies performed better than their PE backed counterparts.
The IPOs with highest issue related expenses belonged to the Financial Services sector, with five companies spending over Rs 100 Crore each.