In 2005, when Nitish Kumar first inherited Bihar as the Chief Minister after defeating Rashtriya Janata Dal supremo Lalu Prasad Yadav, Bihar was not only grappling with social and political issues, but its economic situation earned the state the tag of ‘Bimaru State’ or poorest state of India. Not only the state’s GDP was at its lowest with high unemployment but the state was also dealing with lawlessness. The political-social situation of Bihar during those 15 years was entailed by rampant corruption, despite Bihar being touted as the poorest state in that period.
When Kumar first came to power in 2005, after breaking his alliance with Yadav’s RJD, he made several promises including improving the state of law and order in Bihar, improving the state’s economy, and providing sufficient employment to the state’s native.
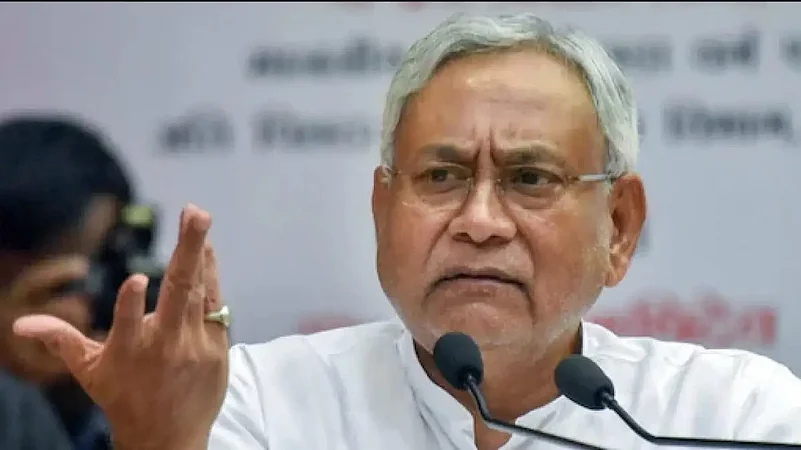
Since then, Kumar has been swapping partnerships in order to remain in power. Earlier this week, Kumar left the NDA alliance, partnered with old foe RJD, and was sworn in as the Chief Minister of Bihar for the eighth time, thus completing 16 years of his governance.
However, despite Kumar’s diligence to helm Bihar and his claims that the state has outperformed under 20 years of his governance, things continue to remain somber for the state. In the last 16 years, even as things have improved on the law and order front, the economical situation of the state continues to be mixed with respect to Yadav’s era. Analysts observe the economic development in Bihar from Yadav to Kumar as a ‘mixed bag.’
Here is a look at how Bihar has performed under Kumar in the last 15 years:
Has Bihar’s GDP improved under Nitish Kumar?
When Kumar first took over the governance in Bihar in 2005, the state's gross state domestic product was only 2.9 per cent between 2001 and 2005 and the state’s growth between 2001 to 2005 was only 34 per cent.
Under Kumar’s governance, the state’s GDP improved significantly between 2005 and 2012. As per a report by the Planning Commission of India, between 2005-2006 and 2011-12, Bihar witnessed a growth rate of 84 per cent.
During Kumar’s two terms as the Chief Minister i.e. in the years 2006-07, 2008-09, 2010-11, and 2011-12, Bihar witnessed the highest growth rate at 17.7 per cent, 14.5 per cent, and 14.7 per cent and 13.1 per cent, respectively. The average growth rate from the year 2005-06 to 2010-11 was 10.93 per cent. However, the state’s growth rate slumped by 7.6 per cent in the year 2015-16. Since then, the third term of the Kumar government has been rocky in terms of growth rate.
Owing to the Covid-19 pandemic, Bihar's Gross State Domestic Product further fell by 2.5 per cent in 2020-21. Meanwhile, during the last five years, the growth of the primary sector in the state was at 2.3 per cent, the secondary sector was at 4.8 per cent and the tertiary sector was at 8.5 per cent. The state’s per capita income was Rs 55,055 in 2020-21, compared to Rs 86,659 in the country.
Does Unemployment Continue To Plague Bihar Under Kumar?
While the state’s growth rate continues to be a matter of worry, another issue that remains unresolved is the state’s unemployment rate. When Kumar inherited Bihar in 2005, the state had the highest unemployment rate. As per reports, in 2004-05, the unemployment rate in the state was 0.8 times the all-India unemployment rate. Moreover, in 2004-05, only 4.2 per cent of individuals had salaried jobs in the state.
However, after 15 years of Kumar's governance, things have changed only marginally for Bihar in terms of unemployment. As per a report by Hindustan Times, in 2011-12 Bihar had 5.8 per cent, salaried individuals. The figures surged in 2017-18, where the individuals with salaried jobs accounted for 13.1 per cent. However, the figure for individuals with salaried jobs again slumped in 2018-19 at 10.4 per cent. Between 2016-17 to 2020-21, as many as 14.28 lakh workers are employed in the state’s construction sector.
In 2022, Bihar became the third state with the highest unemployment rate of 18.8 per cent, following Jammu and Kashmir with the highest unemployment rate at 20.2 per cent, and Rajasthan with the second-highest unemployment at 19.1 per cent.
When this figure is compared to other poor states, Uttar Pradesh has a 3.3 per cent unemployment rate, Madhya Pradesh has a 2 per cent unemployment rate, Jharkhand has a 14 per cent unemployment rate, Assam has a 3.7 per cent unemployment rate, Odisha has a 0.9 per cent unemployment rate, and Tripura has 13 per cent unemployment rate. Notably, Bihar, Madhya Pradesh and Odisha are those states where the governments have not changed in over 20 years.
A major reason behind the high unemployment rate is attributed to the menial or no presence of industries within the state. As per the Economic Survey of the state, agriculture and allied sectors continue to have a crucial space in Bihar’s economy.
Has the Rampant Migrant Crisis in Bihar been resolved?
In the 1990s and early 2000, anti-Bihari sentiments emerged amongst Maharashtrians owing to the mass influx of citizens of Bihar state. Lawlessness and lack of employment opportunities had pushed Bihar migrants to leave their native state and relocate to more industrialized states such as Maharashtra.
When Kumar became Chief Minister in 2005, he vowed to change this, saying that he would create more employment opportunities in the state so no Bihari will have to move out.
However, Kumar’s promises remained unfulfilled. As per a 2018 World Bank paper, migrant remittances had a share of 35 per cent of the state’s GDP.
Moreover, the migrant crisis in the state became glaringly visible as the state grappled with the mass migrant influx, during the first Covid-19 lockdown. More than 15 lakh migrant workers returned to their home state, as the state government struggled to accommodate them.
Sushil Modi, Bihar’s Former Deputy Chief Minister had told The Print, “The return of a large number of migrant laborers is undeniably a challenge for the government. We will see how the workforce can be utilized. We have already created 3.5 crore man days through various government schemes. Hopefully, states will begin to recover after six months and many of the migrant laborers will return with better bargaining power to the place they work in.”
However, the Kumar government failed to provide attractive daily wages compared to other states. According to a report by The Print, in Bihar, the daily wages are only Rs 300 per day, compared to that of Telangana and Kerala where daily wages are Rs 1,200 per day and Rs 1,500 per day, respectively. Owing to low daily wages and lack of employment opportunities, the state again witnessed outmigration once the Covid-19 lockdown eased.
What is the status of the Human Development Index under Kumar?
Between 1990 and 2005, Bihar had the worst human development index. Not only was the state’s healthcare sector in shambles, but the state also failed in terms of sustainable development goals. Kumar came with several promises about improving the quality of life. However, the first and second waves of Covid-19 exposed Kumar’s governance, especially in the healthcare sector. During both the waves, the Bihar government not only struggled to employ sufficient doctors to cater to the patients, but the state administration was also making headlines for lack of healthcare infrastructure.
Furthermore, The Down To Earth’s Annual State of India’s Environment Report 2022 has named Bihar as the worst performing state in terms of eradicating poverty and hunger, improving the quality of education, industry innovation and infrastructure and climate action.
Has the poverty rate improved under Kumar?
In the year 2004-05, when Kumar first helmed the position as the Chief Minister, the poverty rate in Bihar was 54.5 per cent, thus making the state the poorest state in the country. Kumar promised to eradicate poverty. But even after 15 years of Kumar’s governance and the government’s claims of reduction in poverty rate within the state, NITI Aayog’s report says otherwise.
As per the NITI Aayog’s Multidimensional Index 2021, Bihar has emerged as the poorest state with a poverty rate of 51.9 per cent. The report has said that more than 50% of Bihar’s population is multidimensionally poor.
Has the literacy rate improved in Bihar?
Between 1996 and 2006, the education system in Bihar was hanging by a thread. Reflecting on the education system of that era, a study paper titled “State Incapacity By Design: Understanding The Bihar Story,” which is authored by IAS officer Santosh Mathew and University of Sussex Professor Mick Moore says that between 1996 and 2006, “Only 30,000 new primary school teachers were recruited against the 90,000 that were required. The pupil-teacher ratio which was already 90:1 against the national norm of 40:1 worsened to 122:1.” Between 1996 and 2005, the state also witnessed mass cheating during examinations and scams in the recruitment of teachers in schools. In 2001, the state has the lowest literacy state at 47 per cent.
Kumar promised to improve the quality of education. In the last 15 years of Kumar’s governance, despite an improvement in the literacy rate, Bihar continues to have the lowest literacy. For example, in 2011, despite the literacy rate standing at 61 per cent, Bihar was ranked to have the lowest literacy in comparison to other states. Similarly, 11 years later in 2022 as Bihar’s literacy rate stood at 79.7 per cent-- with male literacy rate at 60.5 per cent and female literacy rate at 70.9 per cent, this is however much less in comparison to other states.
Bihar’s literacy rate was marginally higher compared to the country’s average literacy rate which stood at 77.7 per cent, of which male literacy stood at 84.7 per cent, whereas female literacy stood at 70.3 per cent.
However, this was much less in comparison to other poor states, such as Uttar Pradesh, Jharkhand, Madhya Pradesh, and Assam where literacy rates stood at 81.8 per cent, 83 per cent and 81.2 per cent, respectively.
Has the fertility rate improved in Bihar under Kumar?
When Kumar took over Bihar in 2005, the fertility rate was 4.2. But in 2021, it has come down to 3, as per the National Family Health Survey 2019-21 (NFHS-5). However, the state’s fertility rate continues to remain highest among other states and the national fertility rate, which stood at 2, as of 2021.
While the fertility rate in the urban population stood at 2.4, the fertility rate for the rural population of the state stood at 3.1. Compared to Bihar, the fertility rate in Uttar Pradesh, Madhya Pradesh, and Tamil Nadu stood at 2.4, 1.8 and 2, respectively. In UP, for the urban population, the fertility rate stood at 1.9, and for the rural population, the fertility rate stood at 1.9. For Tamil Nadu, the urban fertility rate stood at 1.6 and the rural fertility rate stood at 1.9. In Madhya Pradesh, the fertility rate for the urban population stood at 1.6 and for the rural population, it stood at 2.1.


